Our Results
UIC Votes, By the Numbers
Check out the infographics below for data on how engaged the UIC community is when it comes to voting and elections!
UIC Votes - 2020 Heading link
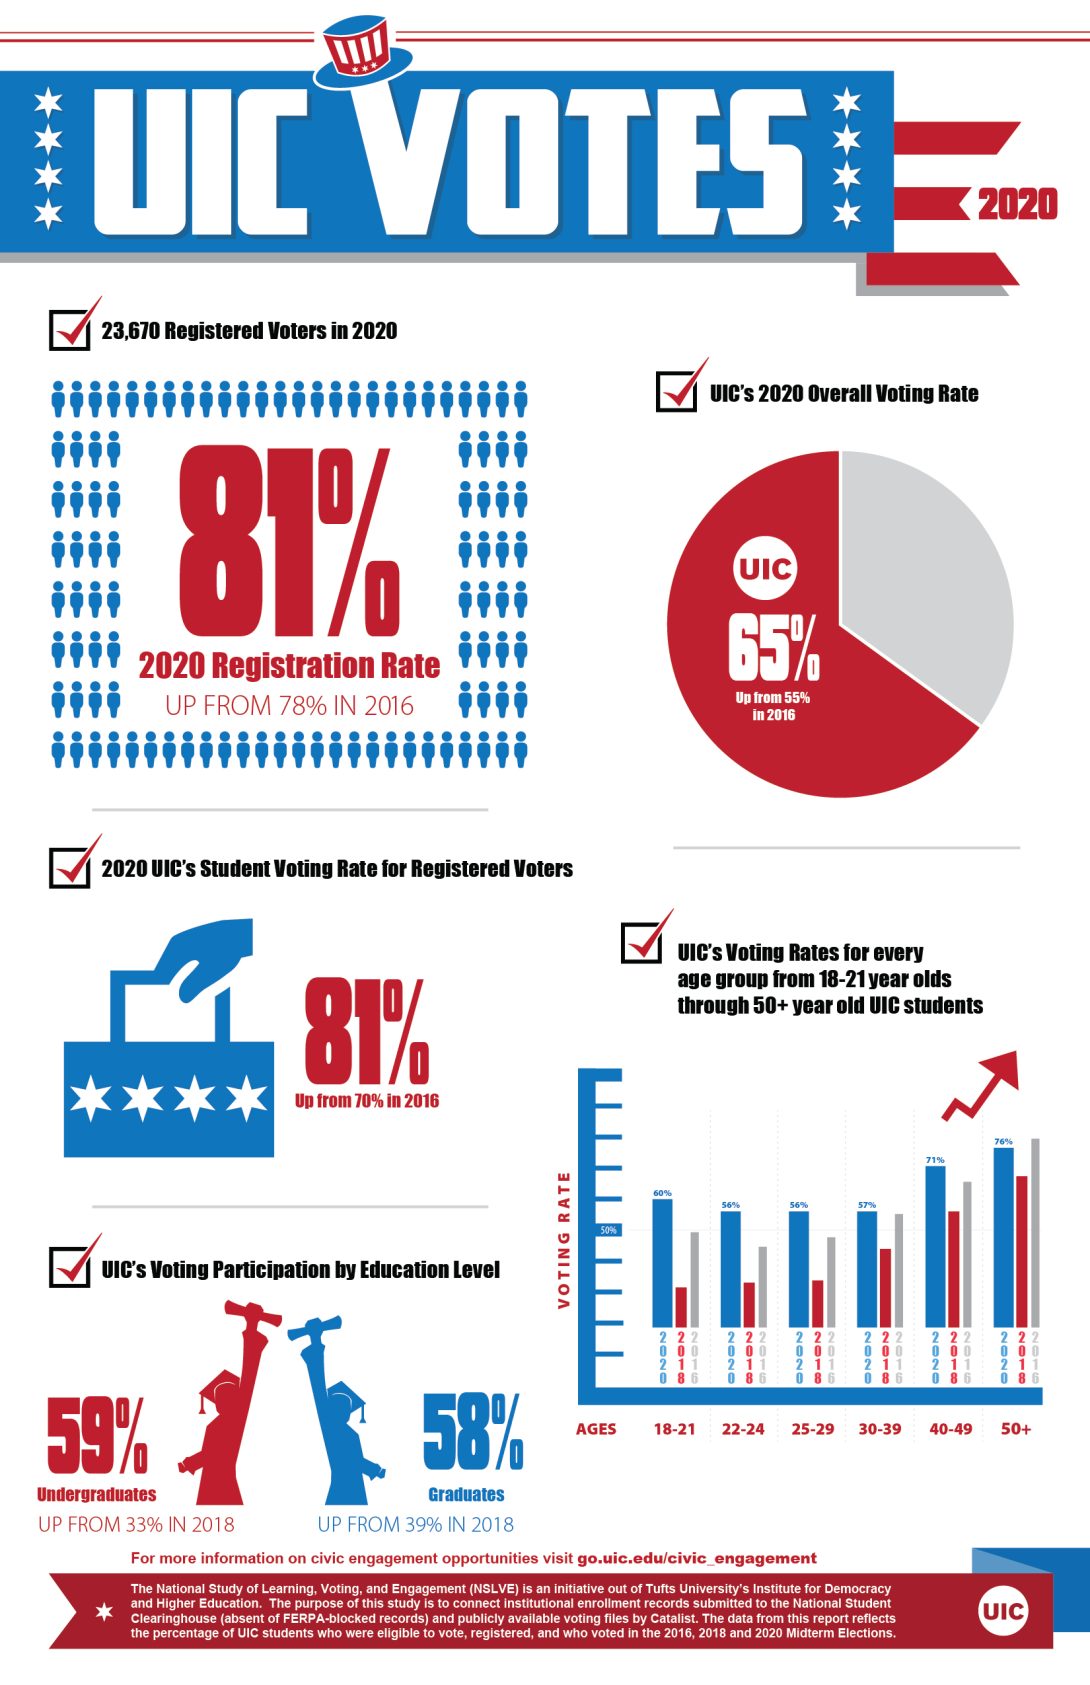
The data from this report reflects the percentage of UIC students who were eligible to vote, registered, and who voted in the 2016 and 2020 Presidential Elections.
23,670 registered voters in 2020 (up from 19,656 in 2016 & 20,158 in 2018)
2020 Registration Rate – 81% (up from 78% in 2016)
2020 UIC’s Student Voting Rate for Registered Voters – 81% (up from 70% in 2016)
2020 UIC’s Overall Voting Rate – 65% (up from 55% in 2016… all institutions average is 66%)
Voting Rates for every age group from 18-21 year olds through 50+ year old UIC students
18-21 y.o. – 60% voting rate (up from 48% in 2016 and 31% in 2018)
22-24 y.o. – 56% (up from 44% in 2016 and 33% in 2018)
25-29 y.o. – 56% (up from 47% in 2016 and 35% in 2018)
30-39 y.o. – 57% (up from 55% in 2016 and 44% in 2018)
40-49 y.o. – 71% (up from 66% in 2016 and 57% in 2018)
50+ y.o. – 76% (down from 79% in 2016 and up from 67% in 2018)
By Education Level –
Undergraduate – 59% (up from 48% in 2016 and 33% in 2018)
Graduate – 58% (up from 48% in 2016 and 39% in 2018)
UIC Votes - 2018 Heading link
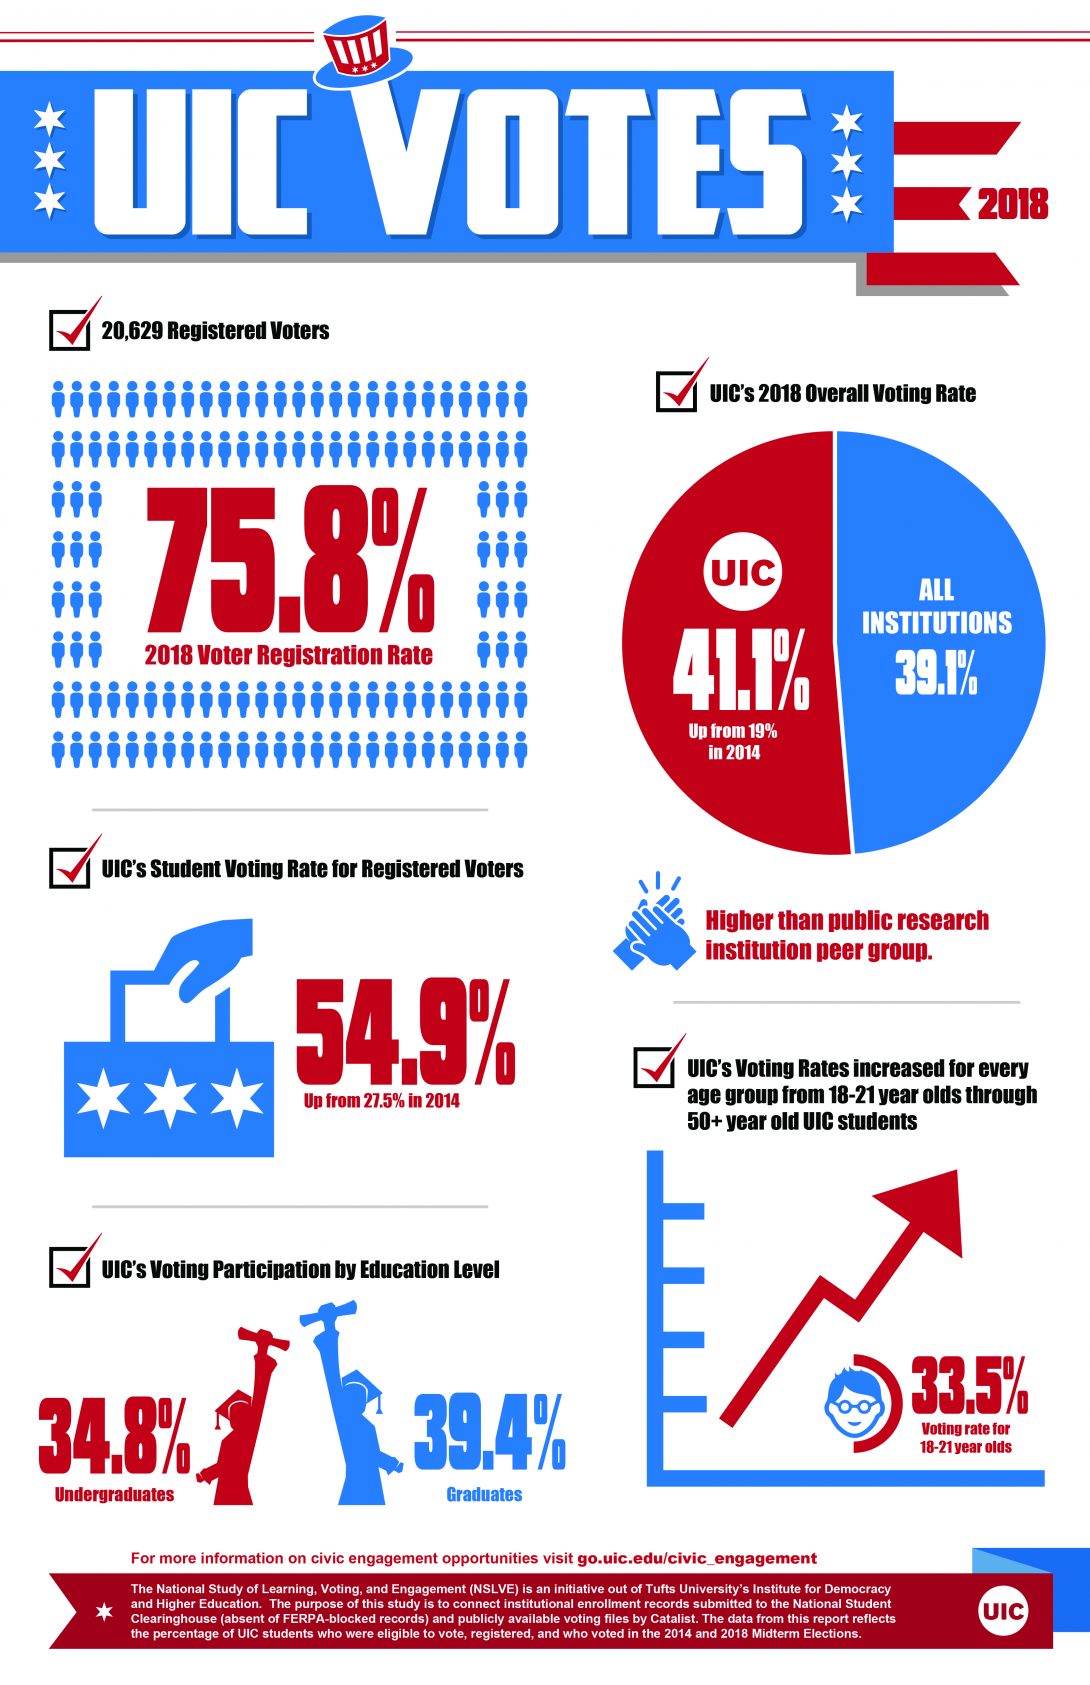
The data from this report reflects the percentage of UIC students who were eligible to vote, registered, and who voted in the 2014 and 2018 Midterm Elections.
20,629 Registered Voters in 2018, 75.8% Voter Registration Rate
41.1% UIC Overall Voting Rate (up from 19% in 2014, and compared to 39.1% at all institutions)
54.9% UIC Student Voting Rate for Registered Voters (up from 27.5% in 2014)
33.5% UIC Voting Rate increase for 18-21 year olds (and UIC’s Voting Rates increased for every age group in 2018)
34.8% Undergraduate Voting Participation, 39.4% Graduate Voting Participation
UIC Votes - 2016 Heading link
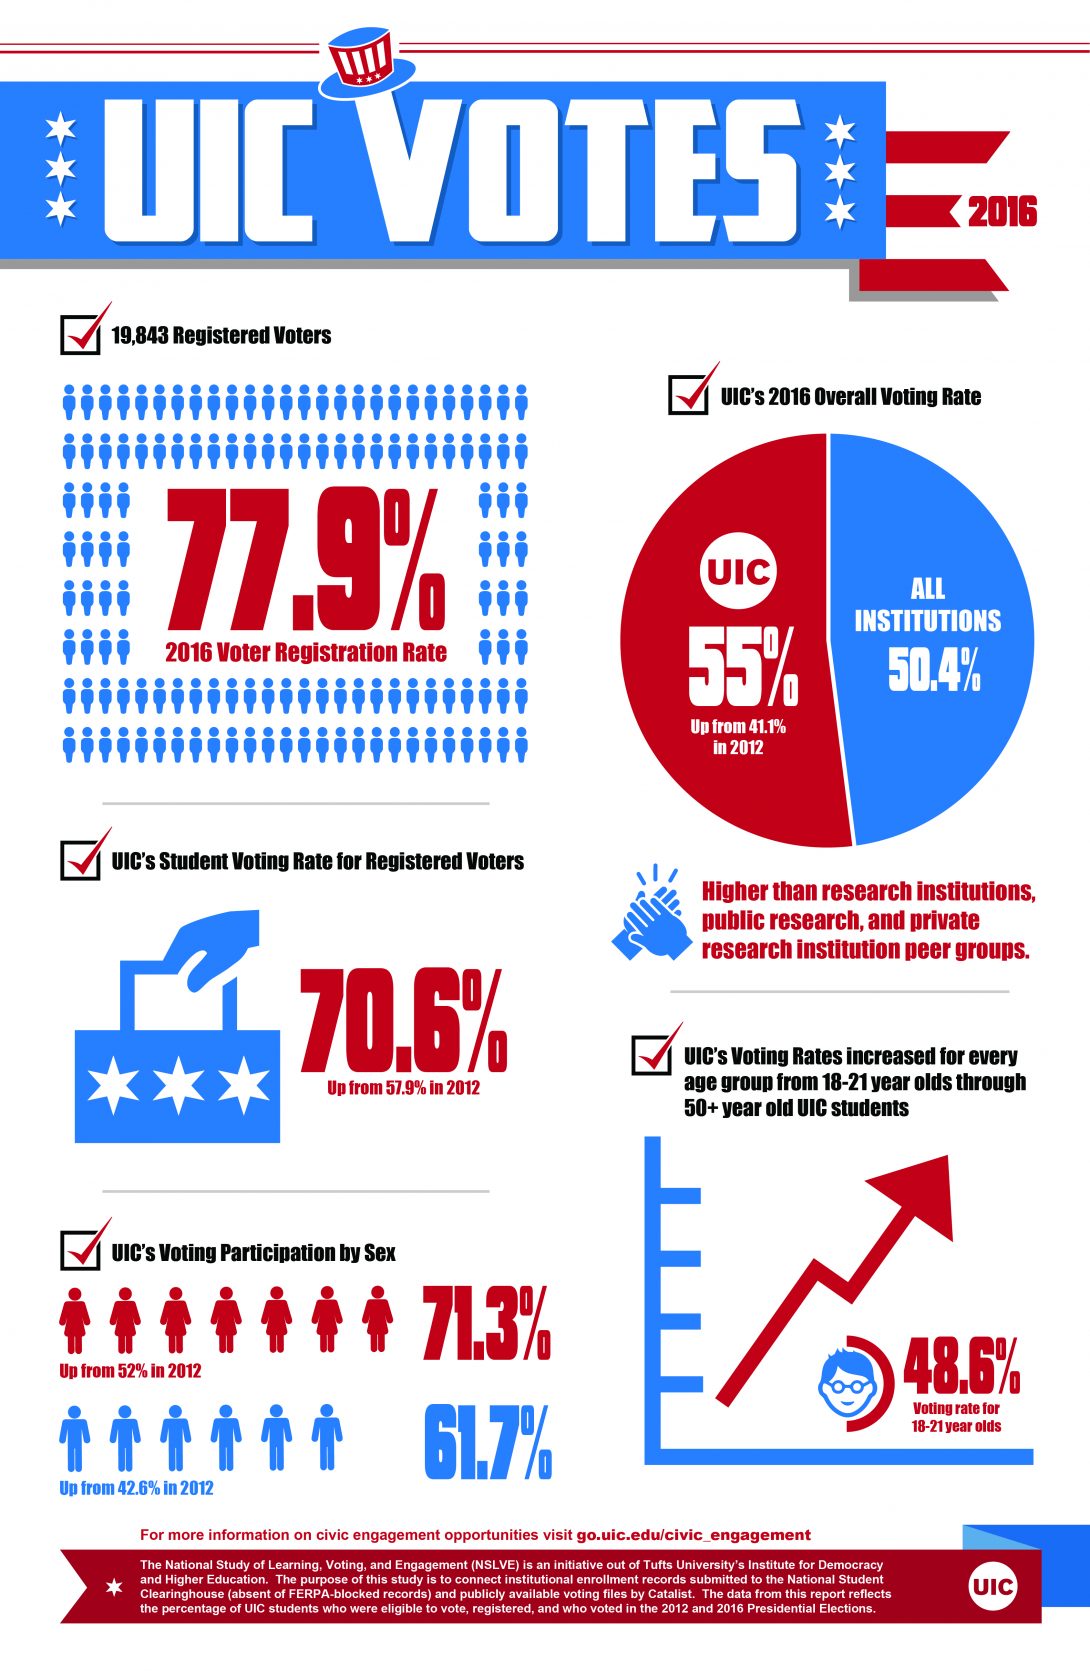
The data from this report reflects the percentage of UIC students who were eligible to vote, registered, and who voted in the 2012 and 2016 Presidential Elections.
19,843 Registered Voters in 2016, 77.9% Voter Registration Rate
55% UIC Overall Voting Rate (up from 41.1% in 2012, and compared to 50.4% at all institutions)
70.6% UIC Student Voting Rate for Registered Voters (up from 57.9% in 2012)
48.6% UIC Voting Rate increase for 18-21 year olds (and UIC’s Voting Rates increased for every age group in 2016)
71.3% Female Student Voting Participation (up from 52% in 2012), 61.7% Male Student Voting Participation (up from 42.6% in 2012)